Performance & Load Benchmark > Headless CMS
Read Operation Benchmark
Webiny Headless CMS performance read benchmark.
- performance of read operations on Webiny Headless CMS
- optimization suggestions
Note that these benchmarks were performed when Webiny was using Amazon Elasticsearch Service as its search engine of choice. And although with the 5.39.0 release Webiny started using Amazon OpenSearch Service, this article is still relevant as the performance of the two services is very similar.
Results
 image
image| Test | Records in database | Records requested | Avg. response time (ms) | p95 response time (ms) | Error rate (%) | Throughput (req/sec) |
|---|---|---|---|---|---|---|
| Test A | 77,197 | 103,489 | 304.32 | 403.00 | 1.65% | 156.74 |
| Test B | 759,679 | 332,303 | 948.87 | 1871.00 | 0.28% | 486.96 |
| Test C | 1,506,112 | 1,402,424 | 449.17 | 587.00 | 0.01% | 2,123.35 |
| Test D | 3,319,812 | 1,718,146 | 838.01 | 1035.00 | 1.23% | 2,043.43 |
| Test E | 3,343,666 | 2,964,663 | 484.37 | 1355.00 | 0.01% | 3,510.60 |
What Does This Mean?
Requests per second is a number that helps you calculate how many users you can actually serve. The other part of that calculation is to know how your users behave. How many calls to the read API they are doing in a set time period.
As an example say your average visitors stays on your site 5 minutes, and does around 10 calls to the read API. Based on the throughput (req/sec) and this user behavior you can exact the following estimated values for how many concurrent users you can serve within that period:
| Test | Throughput (req/sec) | Concurrency |
|---|---|---|
| Test A | 156.74 | 4,702 |
| Test B | 486.96 | 14,608 |
| Test C | 2,123.35 | 63,700 |
| Test D | 2,043.43 | 61,302 |
| Test E | 3,510.60 | 105,318 |
Formula: (Throughput*60sec*5min)/10 calls per user = total number of concurrent users in a 5 minute period
Note: This is the formula for ideal conditions where user requests have an ideal spread of time between requests.
What Is the Error Rate?
It’s very hard to correctly estimate what is the exact number of req/sec a certain Elasticsearch instance can take. In our tests as long as the error rate was below 2% we marked the test as successful as it was giving us a fair estimate of how much load we can send to the API. Of course in production cases, if you’re constantly seeing errors, you would upgrade your instance.
Benchmark Overview
In this benchmark we are doing a GraphQL query to the Headless CMS Preview API. The query is requesting an “Order” record by providing the OrderID attribute. Note that OrderID is a random attribute and not the built in id attribute which is the primary key in the database. We wanted to test filtering on a sample attribute.
Here is the full query that is being issued:
{
  listOrders(where:{orderId: ${OrderID}}){
    data{
      id
      orderDate
      totalPrice
      country{
        name
        region{
          id
          name
        }
      }
      itemType{
        name
      }
    }
  }
}
The OrderID variable is replaced on each request with a random value for which we know a record exists. Inside the test we provided a sample set of 100.000 random values and also we are not configuring any cache settings in the system.
From the query you can see we are requesting the top-level record, but also 2 referenced attributes (country & itemType) on the 2nd level and also a 3rd level nested attribute (region). This query we believe is representative to what you would use in production scenarios.
Test Plan
This test is following the same plan and load structure as the Headless CMS write operation benchmark.
Request Flow
Every API read request has the following flow:
Client -> CloudFront -> ApiGateway -> Lambda -> Elasticsearch
There is also a different flow, where the Lambda function goes to DynamoDB instead of Elasticsearch. This is only when the client is requesting a single object and is providing a primary key for that object.
All other requests go Elasticsearch as it provides better filtering, searching and sorting capabilities. We decided to test the Elasticsearch in our benchmark as it will be a more common one in production. In terms of the performance on the DynamoDB flow, it will be similar to what you see in the Headless CMS Write API benchmark.
Report
We only extracted the charts for the last 2 tests as most charts showed the same behavior. In case you want to see the full report with all the charts for all the tests, click here
Response Time
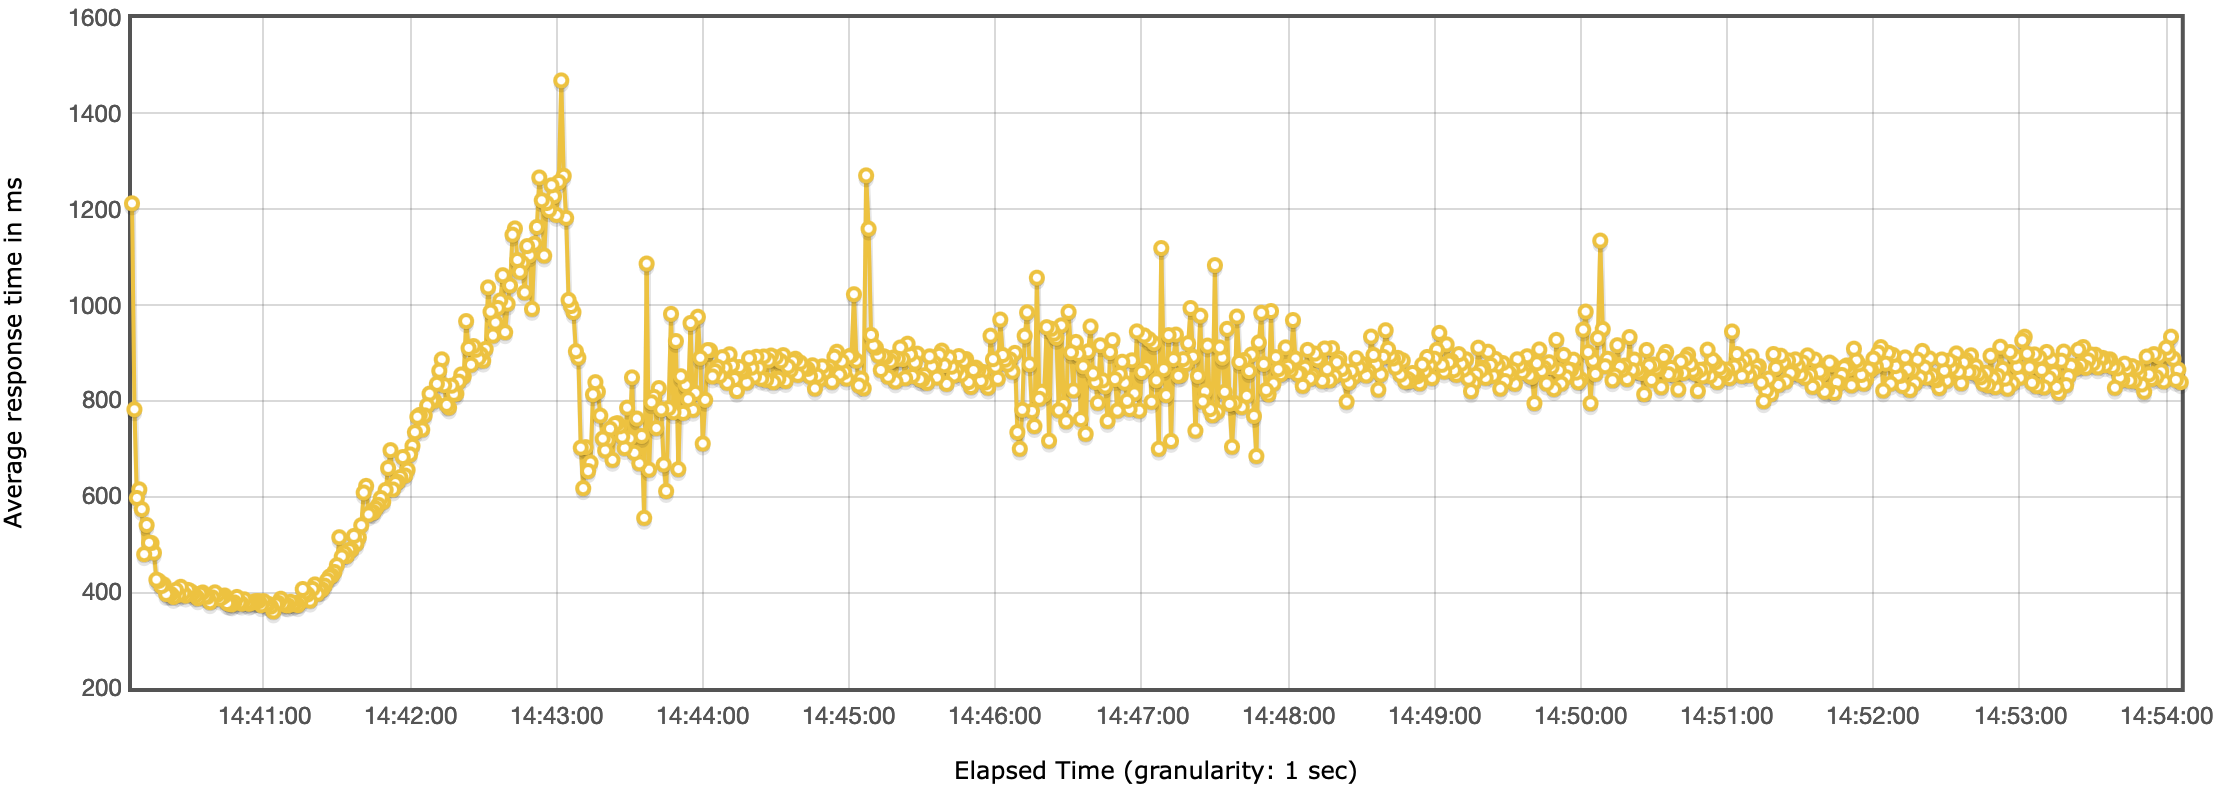
Test D
 Headless CMS benchmark - Response time
The response time was mostly consistent, with the exception around the 14:21 mark. At that point the response times spiked for a few seconds but then leveled off to the previous performance and stayed stable for next 5 minutes, until the end of the test.
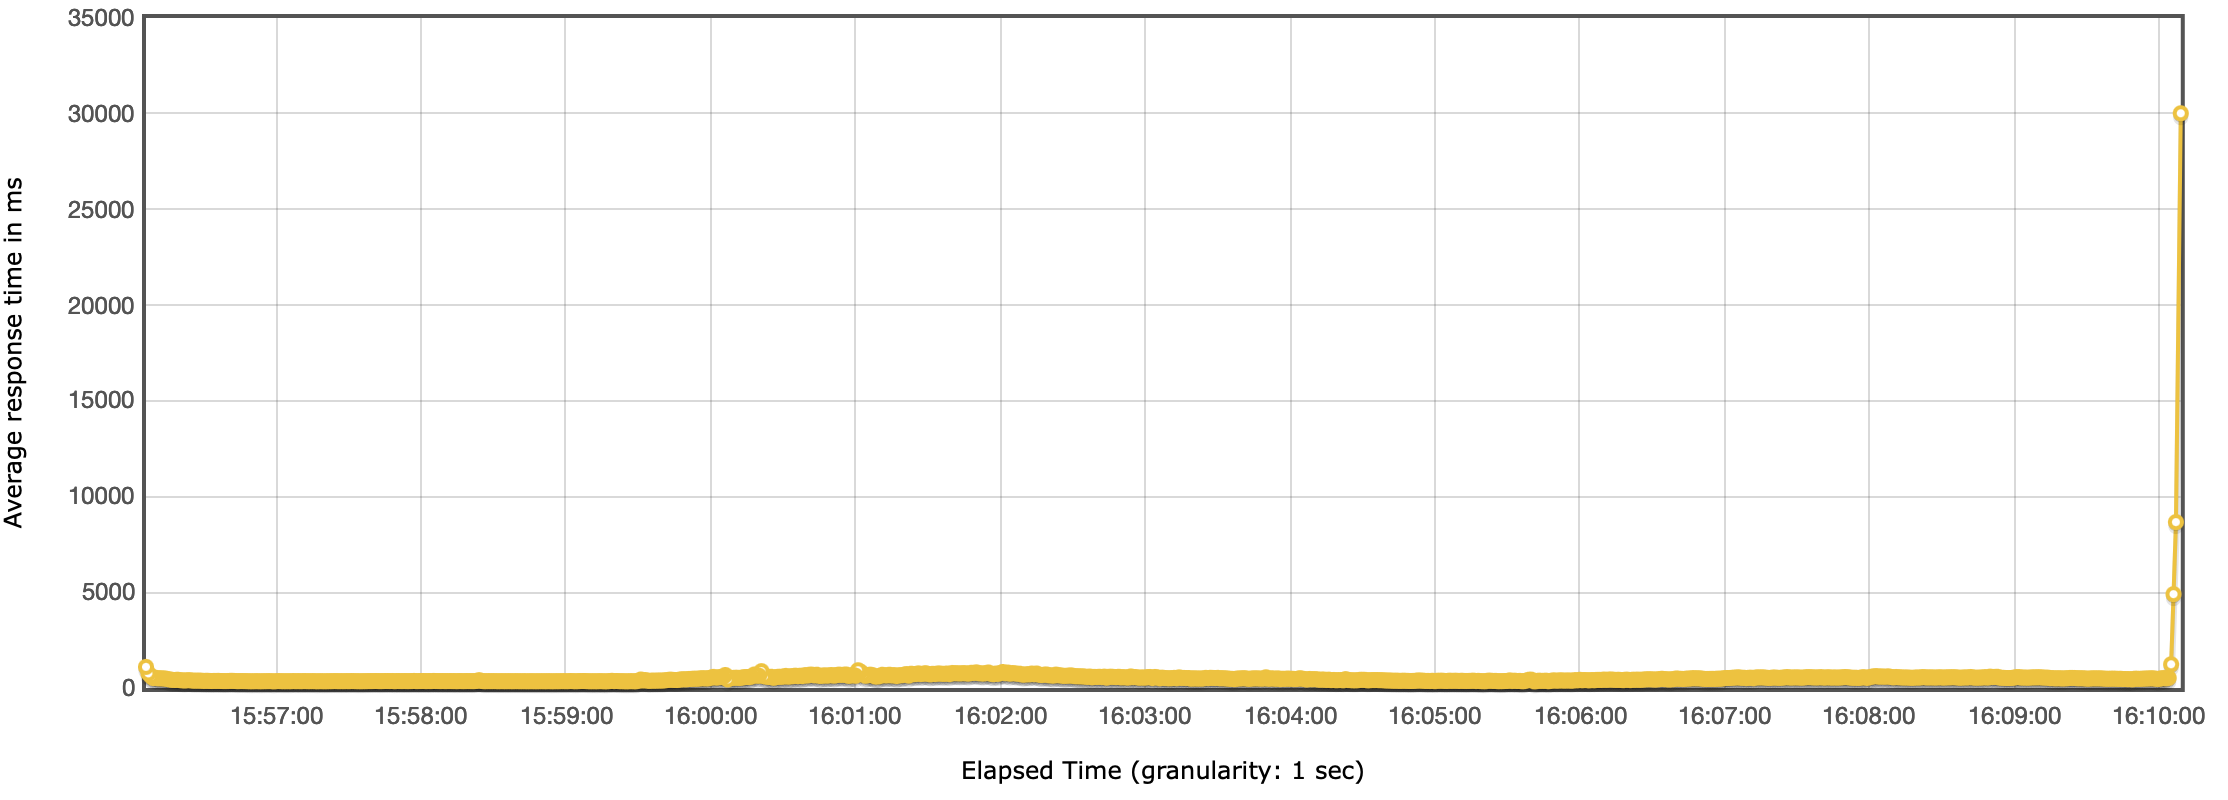
Test E
 Headless CMS benchmark - Response time
Throughput
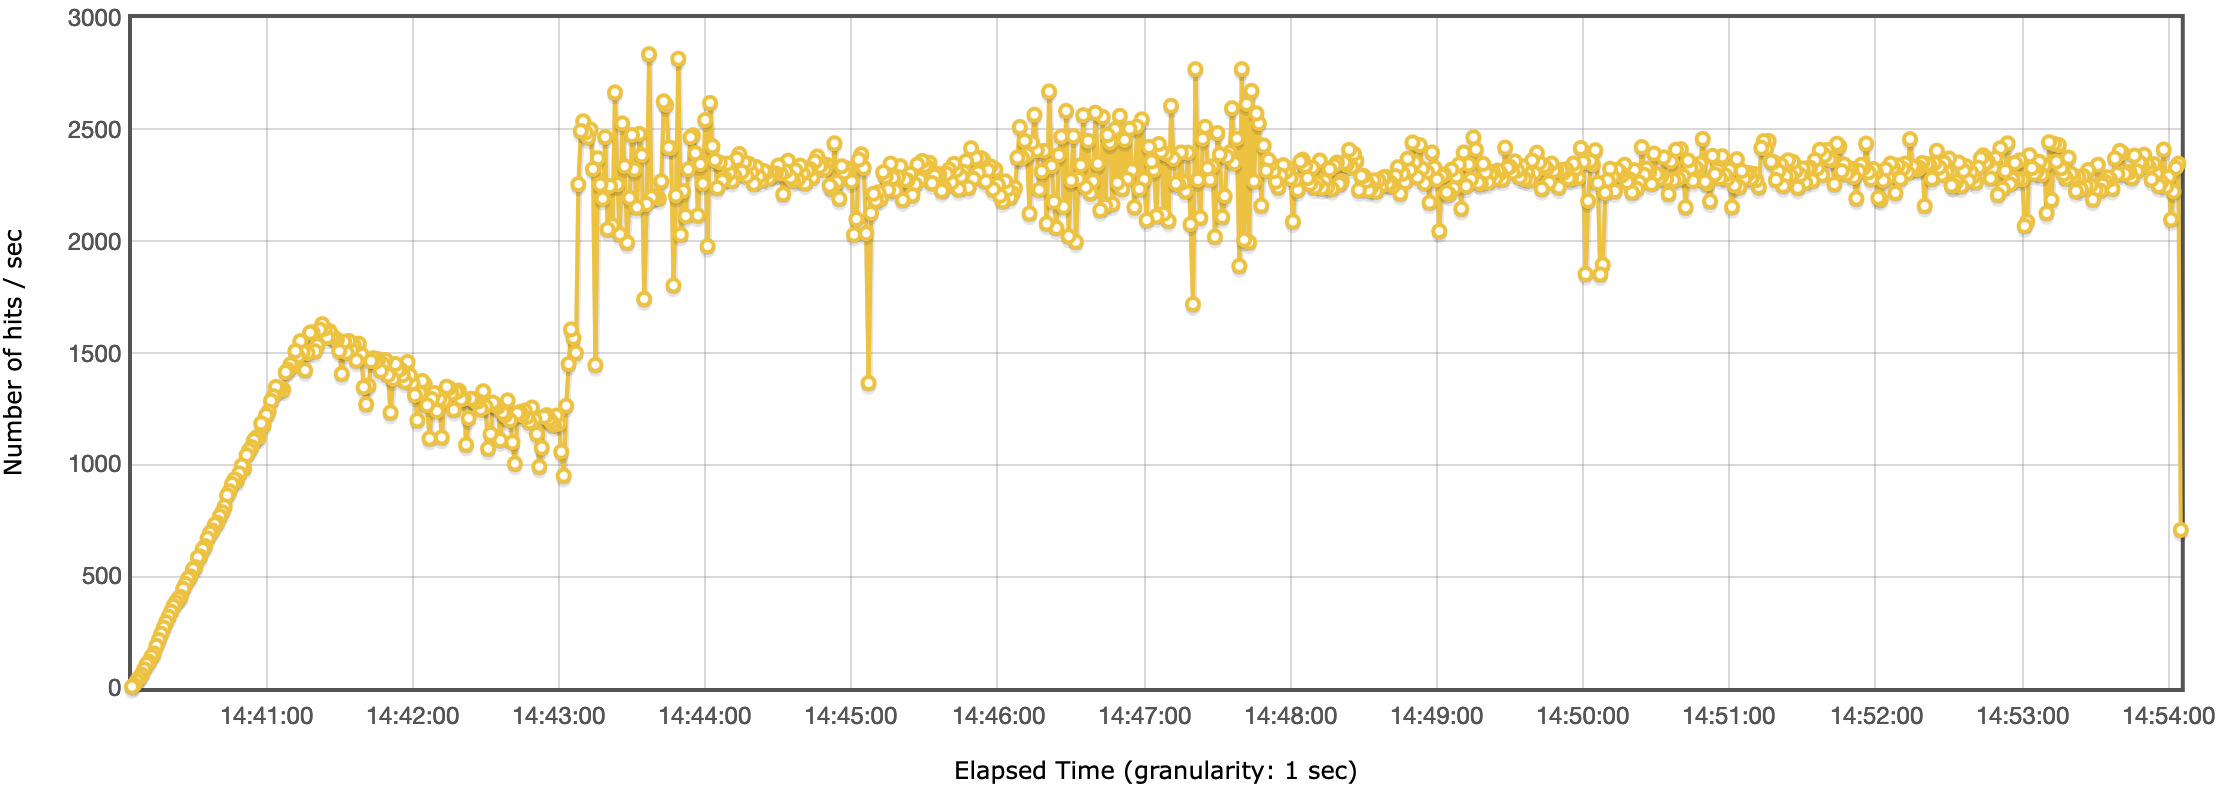
Test D
 Headless CMS benchmark - Throughput
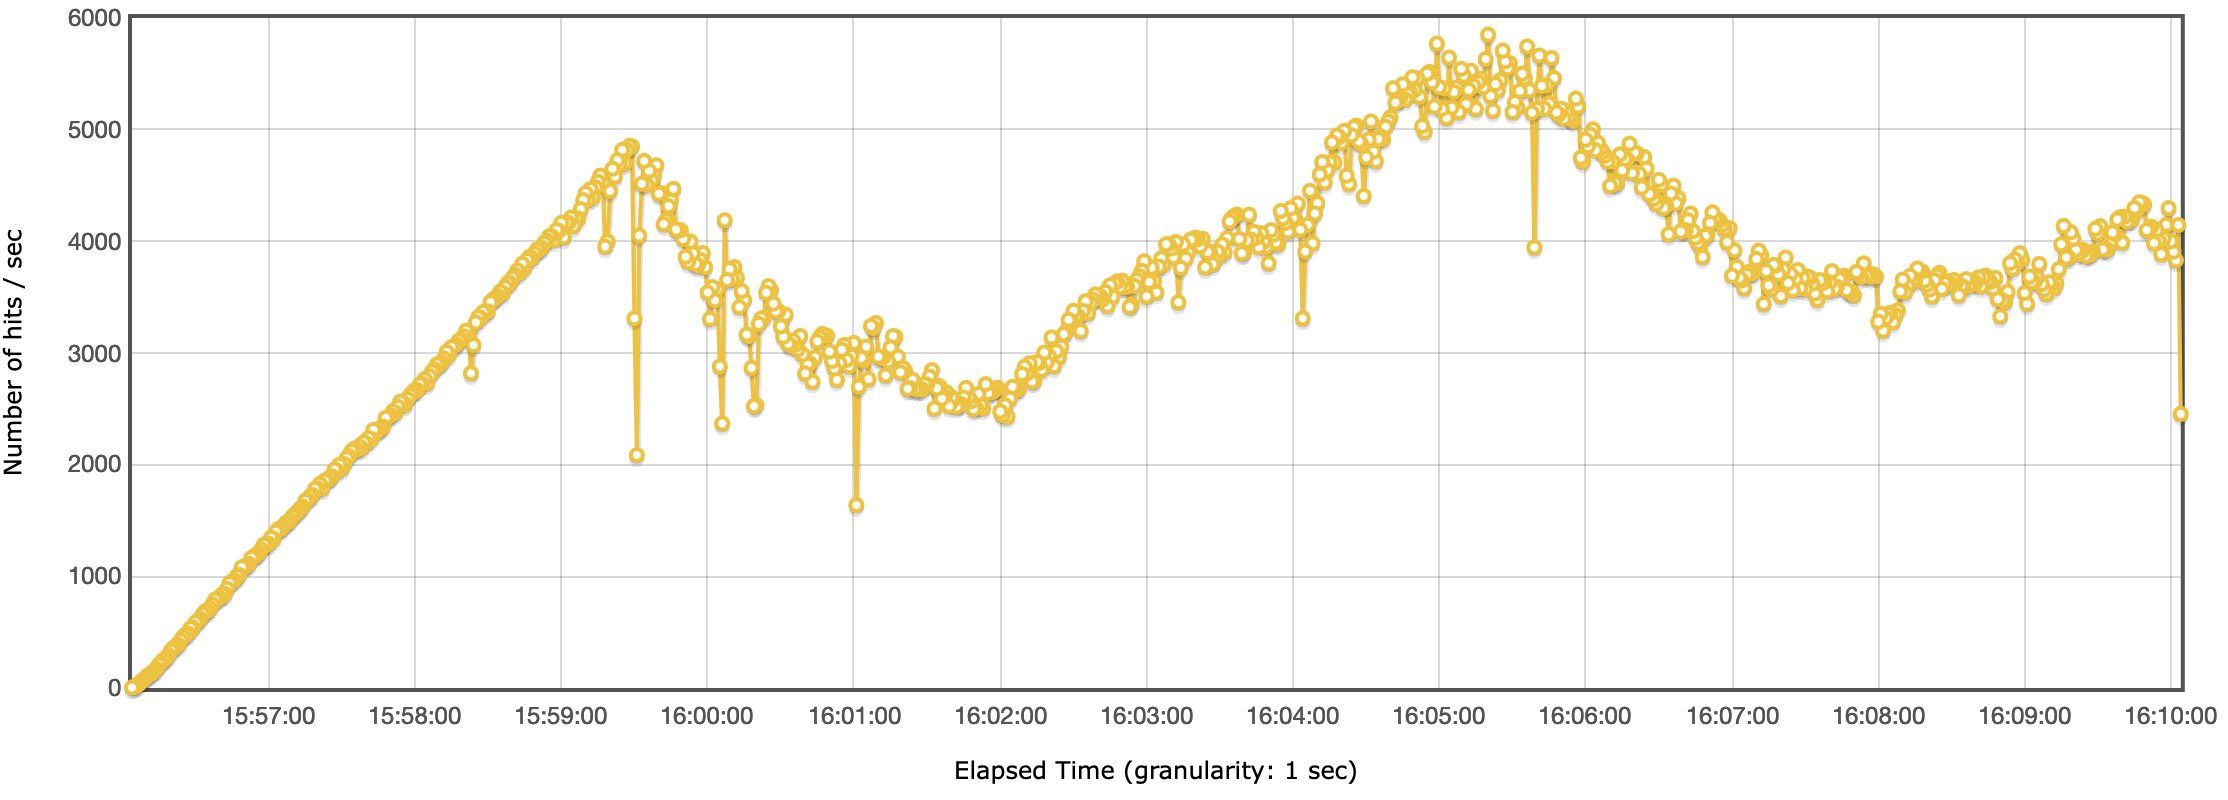
Test E
 Headless CMS benchmark - Throughput
In line to what we see in the response times, we see a drop in the throughput around the same time.
After investigating the CloudWatch metrics, we couldn’t find anything that would point to the fact that the drop in performance was to the AWS services. The response times on the CloudFront, API Gateway and Lambda functions haven’t changed. The only explanation we have is that it was a limit we hit either on the network or CPU on the load test machine.
Why Is Read Sometimes Slower Than Write?
As you probably noticed, the read operation is actually slower than the write operation, which might seem odd as write is the more operationally costly one.
The key here is in the architecture. The flow of the write operation looks like this:
Client -> CloudFront -> API Gateway -> Lambda -> DynamoDB -> (stream) -> Elasticsearch
While the read operation looks like so:
Client -> CloudFront -> API Gateway -> Lambda -> Elasticsearch
There is still a DynamoDB request in the read, but it’s only used to retrieve and validate the user’s access token.
In the write operation we don’t talk to Elasticsearch synchronously, rather over an async stream. This means that Elasticsearch doesn’t slow down the main request.
In the read operation there is no DynamoDB, the read operations go and talk directly to Elasticsearch. The reason for this is that DynamoDB, although a very powerful and scalable database is very feature-limited when it comes to filtering, sorting and searching.
This usually is not a problem when you know your access patters as you can model your data accordingly. However with a headless CMS you cannot predict what models the users will build and how will they access their data. Because of that we couldn’t rely on DynamoDB as the primary database for the read operations.
To increase your throughput for the read operations you would need to scale your Elasticsearch cluster accordingly.
Cost
Total Cost
| Test | CloudFront | ApiGateway | Lambda | DynamoDB | Elasticsearch | Total |
|---|---|---|---|---|---|---|
| Test A | $0.10 | $0.10 | $0.26 | $0.33 | $0.01 | $0.80 |
| Test B | $0.35 | $0.33 | $2.60 | $0.54 | $0.08 | $3.90 |
| Test C | $1.47 | $1.40 | $5.17 | $1.40 | $0.33 | $9.77 |
| Test D | $1.80 | $1.72 | $11.90 | $1.93 | $0.92 | $27.50 |
| Test E | $3.11 | $2.96 | $11.77 | $3.57 | $2.68 | $24.09 |
The cost of serverless components has been calculated based on their usage. The cost of Elasticsearch has been calculated for a 15min period, based on the hourly rate.
Notice how the test E is cheaper than test D, while E handled almost 3M requests during the test, versus test E that handled 1.72M. The only difference was in the Elasticsearch instance.
Cost per 10k Requests
 image
image| Test | Hits | Total cost | Cost per request |
|---|---|---|---|
| Test A | 77,197 | $1.01 | $0.000013083 |
| Test B | 759,679 | $7.73 | $0.000010175 |
| Test C | 1,506,112 | $15.25 | $0.000010125 |
| Test D | 3,319,812 | $34.52 | $0.000010398 |
| Test E | 3,343,666 | $34.79 | $0.000010405 |
CloudFront
| Test | Hits | Traffic (GB) | Cost |
|---|---|---|---|
| Test A | 103k | 0.06 | $0.10 |
| Test B | 332k | 0.20 | $0.35 |
| Test C | 1.4M | 0.81 | $1.47 |
| Test D | 1.72M | 1 | $1.80 |
| Test E | 2.96M | 1.74 | $3.11 |
API Gateway
| Test | Hits | Cost |
|---|---|---|
| Test A | 103k | $0.10 |
| Test B | 332k | $0.33 |
| Test C | 1.4M | $1.40 |
| Test D | 1.72M | $1.72 |
| Test D | 2.96M | $2.96 |
Lambda
| Test | Requests | Avg. Duration (ms) | Cost |
|---|---|---|---|
| Test A | 103k | 278 | $0.26 |
| Test B | 332k | 916 | $2.60 |
| Test C | 1.4M | 419 | $5.17 |
| Test D | 1.72M | 806 | $11.90 |
| Test E | 2.96M | 453 | $11.77 |
Lambda costs also include the cost that’s occurred by the DynamoDB stream. Webiny uses Lambda functions with 512MB of memory.
Notice the difference in lambda costs between tests C and D, versus the number of requests. This shows that you can technically save some costs by using a more expensive Elasticsearch instance, as it will improve the performance of your lambdas. Same thing is even more obvious between tests D and E.
DynamoDB
| Test | Read ops | Write ops | Cost |
|---|---|---|---|
| Test A | 317k | 0 | $0.33 |
| Test B | 1.16M | 0 | $0.54 |
| Test C | 5.61M | 0 | $1.40 |
| Test D | 7.7M | 0 | $1.93 |
| Test E | 13.3M | 0 | $3.57 |
DynamoDB is only used to retrieve and validate the user’s access token.
The cost is calculated by estimating the database size to 1GB.
You can download and check the full report here: https://github.com/webiny/benchmark/tree/main/benchmarks/results/hc-read-data